Property reading by satellite
Map rural properties, plots and production areas with multispectral and radar imagery to track crops, management and operational risk.
Monitor crops, rural properties and production cycles with satellites, geospatial AI and automation. The platform connects maps, indicators, field communication and evidence in one operation.
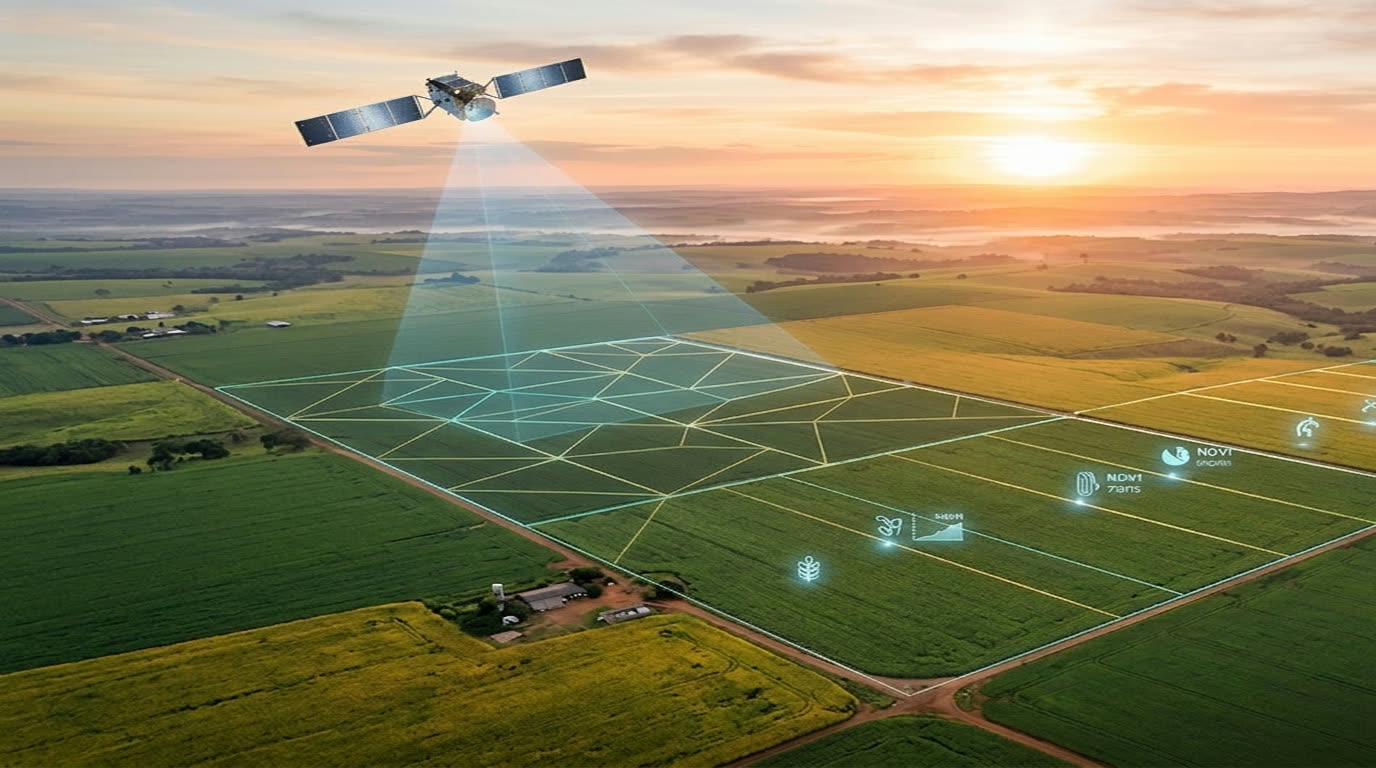
Turn satellite imagery, maps, production indicators and rural communication into a digital operation to monitor the field faster.
Map rural properties, plots and production areas with multispectral and radar imagery to track crops, management and operational risk.
Track NDVI, EVI and NDRE over time to identify planting, crop vigor, harvest and abnormal behavior.
Separate main and second crops, compare spectral signatures and record confidence, agricultural window and technical source for each reading.
Combine plots, regional productivity, agricultural calendar and history to estimate productive area, production potential and crop variations.
Configure periodic routines to reprocess critical areas, update indicators and prioritize events that require quick action.
Send summaries, maps and requests through WhatsApp with consent, protocol and history to connect teams, producers and management.
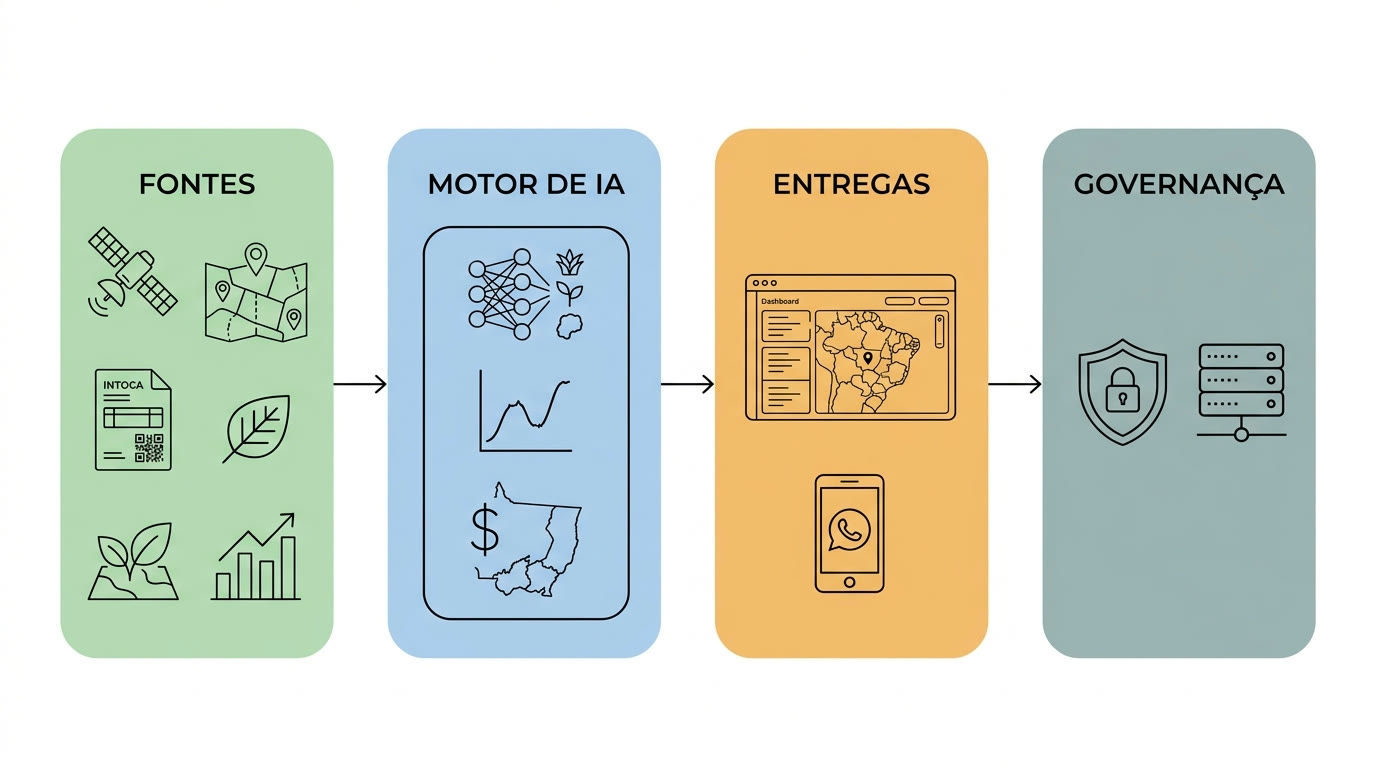
The solution combines public data, proprietary layers, geospatial AI and active communication to reduce manual analysis and accelerate decisions.
Use rural polygons, municipalities, crops of interest and operational cuts to build the initial view of the territory.
The platform crosses imagery, agricultural calendar, weather and time series to generate readings by production cycle.
Alerts, maps, scores and reports highlight properties, crops and regions that deserve closer monitoring.
Record evidence, send communications, receive explanations and keep complete history for decision making.
Video materials were transformed into a public product narrative: robust, visual and oriented to agribusiness operations.
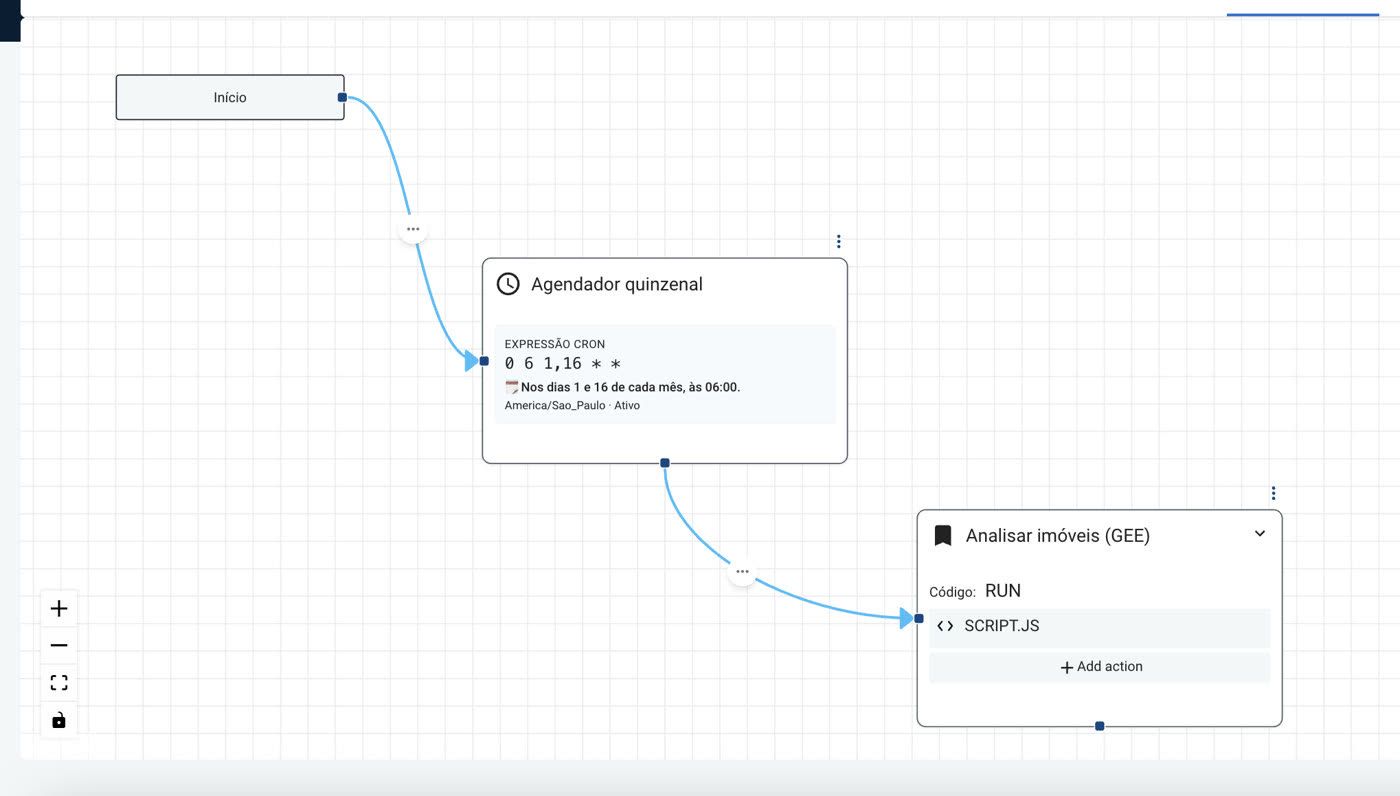
Scheduled routines monitor selected areas, update indicators and record new events in the timeline.
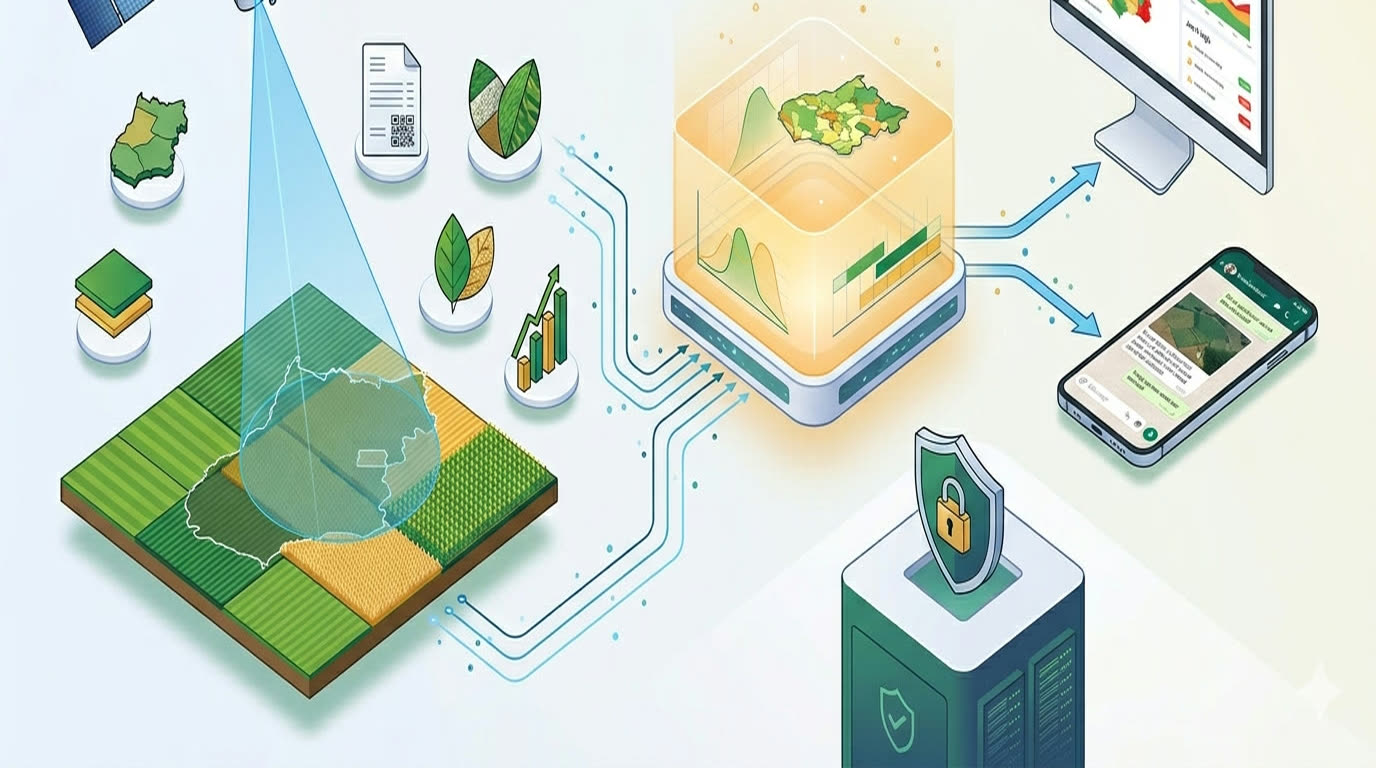
Dashboards combine map, images, plots, likely crop, estimated production and visual explanation in one experience.

The producer receives images, summaries and WhatsApp messages with consent, history and responses connected to the project.

The AI layer accelerates queries, summarizes readings, retrieves history and turns geospatial data into actionable answers for field, agricultural management and commercial teams.
Rural polygons, orbital images, regional productivity, weather, history and internal data coexist in the same context.
Natural language queries access authorized data, explain indicators and help teams navigate the territory.
Each reading preserves crop, source, date, model version and visual evidence to support operational decisions.
Dashify registration is already oriented by business type. Each vertical can have modules, templates, data sources, automations and journeys without rewriting the platform.
Satellites, crops, properties, productivity, maps and rural relationships.
Production, maintenance, asset, efficiency and industrial operation dashboards.
Indicators for clinics, care journeys, quality and continuous care.
Course, enrollment, learning, retention and student relationship management.
Dashboards for service, finance, productivity, contracts and daily operations.
Start with a pilot area, connect your data and evolve to a recurring operation with maps, reports, alerts and relationship management.